
When looking for a job (IT industry), in addition to common software development, machine learning positions can also be regarded as a choice. Many graduate students in computer orientation will contact this. If your research direction is machine learning/data mining, etc. And if you are very interested in it, you can consider this position. After all, machine learning can be an important means before machine intelligence reaches human level. With the continuous development of technology, I believe that the talent demand in this area will also be getting bigger.
Looking at the recruitment positions in the IT industry, there are still quite a few jobs in machine learning. Baidu, Ali, Tencent, Netease, Sohu, and Huawei (the positions of Huawei are basically randomly assigned, machine learning, etc.) Basically , there are related positions, such as doctors , and other small and medium-sized enterprises and foreign companies in China will also recruit a small portion. Of course, most of them are Baidu Beijing's most important people, hundreds of people. A large part of Ali's algorithmic position is also related to machine learning.
There is no doubt that sub-fields of machine learning/artificial intelligence have become increasingly popular in the past few years. Big data is already hot in the technology industry, and machine learning based on large amounts of data to make predictions or make recommendations is undoubtedly very powerful. Some of the most common machine learning examples, such as Netflix's algorithms, can recommend movies based on movies you've seen before, while Amazon's algorithms can recommend books based on books you've bought before.
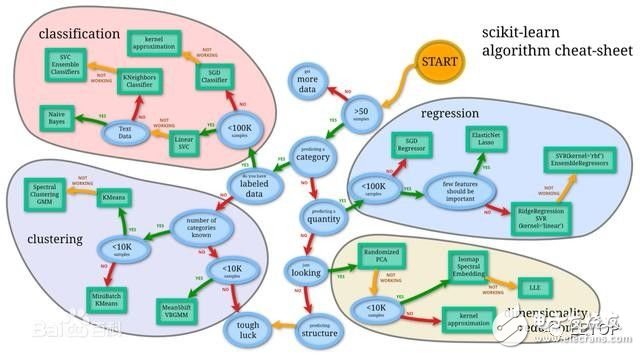
In this article, share some of the most common machine learning algorithms.
Machine learning algorithms can be divided into three categories: supervised learning, unsupervised learning, and reinforcement learning .
Supervised learning can be used when a particular data set (training set) has a certain attribute (tag), but other data has no tags or needs to be predicted. Unsupervised learning can be used for a given unlabeled data set (data is not pre-allocated) in order to find out the potential relationships between the data. Reinforcement learning lies between the two, and each prediction has some form of feedback, but there is no precise label or error message. Because this is an introductory course, I have not studied the content of intensive learning, but I hope the following 10 algorithms for supervised learning and unsupervised learning are enough to interest you.
Supervised learning
1. Decision Trees
A decision tree is a decision support tool that uses a tree or decision model and a sequence of possibilities, including the results of incidents, resource costs, and utility.
According to some features, each node asks a question. By judging, the data is divided into two categories, and then continue to ask questions. These problems are learned from existing data. When new data is added, the data can be divided into appropriate leaves according to the problem on the tree.
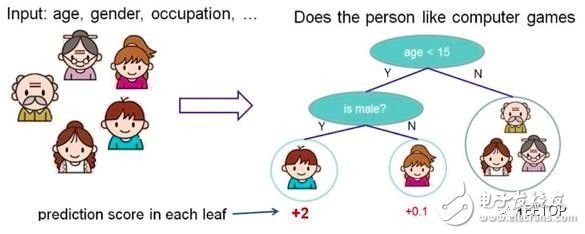
Decision tree
The advantages of decision trees:
The calculation amount is simple, the interpretability is strong, and it is more suitable for processing samples with missing attribute values, and can deal with irrelevant features;
Disadvantages:
Easy to overfit (following random forests, reducing over-fitting);
2. Naive Bayesian classification
The naive Bayes classifier is a simple class of probability classifiers based on Bayes' theorem and strong (simple) independent assumptions between features. In the figure is the Bayesian formula, where P(A|B) is the posterior probability, P(B|A) is the likelihood, P(A) is the class prior probability, and P(B) is the prediction prior probability.
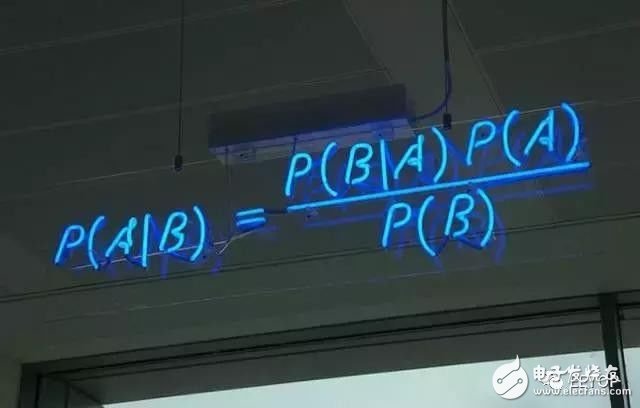
Naive Bayes
Some application examples:
Judge spam
Classify categories of news, such as technology, politics, sports
Determine whether the feelings expressed in the text are positive or negative
Face recognition
The advantages of Naive Bayes:
It works well for small-scale data and is suitable for multi-category tasks, suitable for incremental training.
Disadvantages:
Very sensitive to the form of input data.
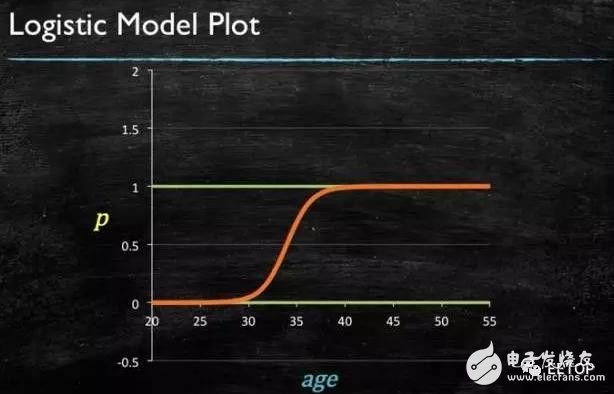
3. Logistic Regression
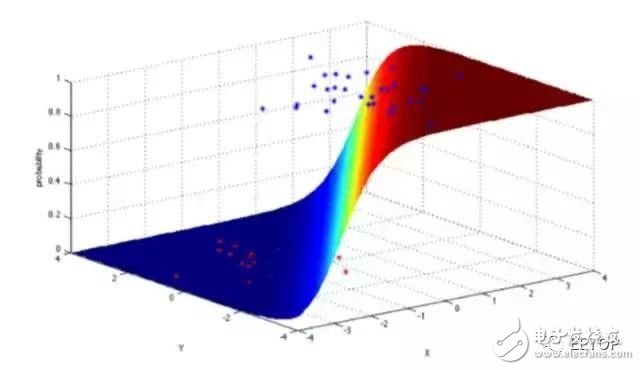
Logistic regression is a powerful statistical method that can use one or more explanatory variables to represent a binomial result. It measures the relationship between a class-dependent variable and one or more independent variables by using a logic function to estimate the probability, which obeys the cumulative logical distribution.
In general, logistic regression can be used in the following real-world scenarios:
Credit score
Calculate the success rate of marketing activities
Predict the revenue of a product
Whether an earthquake will occur on a particular day
Logistic regression advantages:
1, the implementation is simple;
2. The calculation amount is very small when sorting, the speed is fast, and the storage resources are low;
Disadvantages:
1, easy to underfit, the general accuracy is not too high
2, can only deal with two classification problems (softmax derived on this basis can be used for multi-classification), and must be linearly separable;
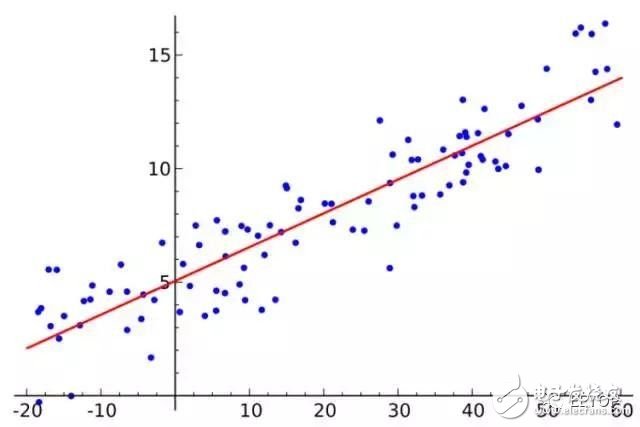
4. Linear regression:
Linear regression is really used for regression, and logistic regression is used for classification. The basic idea is to use the gradient descent method to optimize the error function in the form of least squares. Least squares is a method for calculating linear regression. . You can think of linear regression as a straight line through a set of points. There are many ways to do this. The "least squares" method is like this: you can draw a line, then for each data point, calculate the vertical distance from each point to the line, and then add them up, then the final result The straight line is the distance and the smallest possible line.
Linear regression advantages:
Simple implementation and simple calculation;
Disadvantages:
Cannot fit nonlinear data;
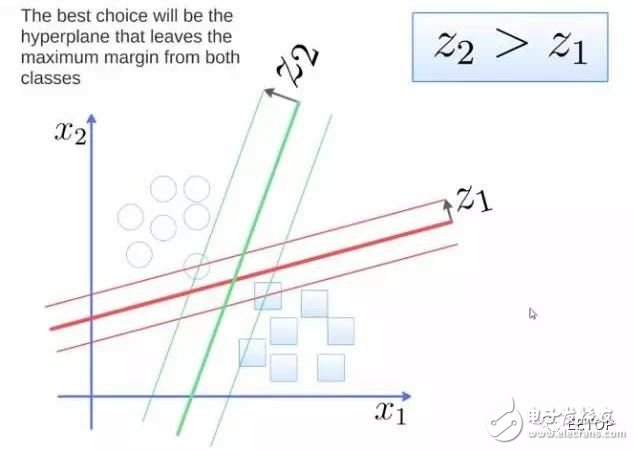
5. Support Vector Machine (SVM)
SVM is a binary classification algorithm. Given two types of points in N-dimensional coordinates, the SVM generates (N-1) dimensional hyperplanes to divide these points into two groups. Suppose you have two types of points that can be separated linearly on a plane. The SVM will find a line, divide the points into two types, and keep the line as far as possible from all of them.
In terms of scale, some of the biggest problems solved using SVM (with appropriate modifications) include display advertising, human splice site recognition, image-based gender detection, large-scale image classification...
SVM algorithm advantages:
Can be used for linear/nonlinear classification and can also be used for regression;
Low generalization error;
Easy to explain;
Lower computational complexity;
Disadvantages:
Sensitive to the choice of parameters and kernel functions;
The original SVM is only good at dealing with the two classification problem;
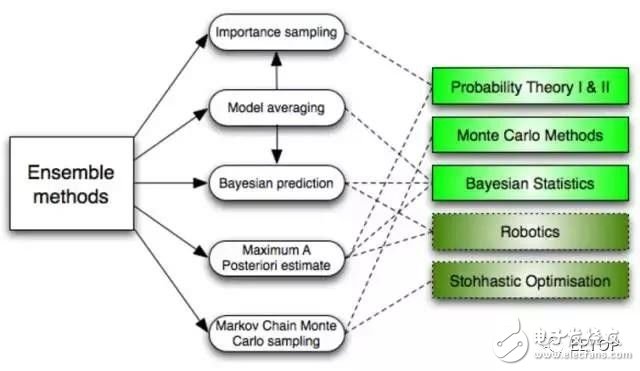
6. Ensemble methods
The integration method is a learning algorithm that classifies new data points by constructing a set of classifiers and then weighting votes through their predictions. The original integration method is Bayesian averaging, but recent algorithms include error correction output coding, Bagging, and Boosting.
So how does the integration method work? And why are they better than a single model?
They average the deviation of a single model: if you average the Democrat poll and the Republican poll, you will get a balanced outcome, not biased towards either side.
They reduce the variance: the overall opinion of a set of models is more uniform than the single opinion of any of the models. In the financial sector, this is called diversification. There are many stock combinations that are less uncertain than a single stock, which is why your model is better in the case of more data.
They are less likely to overfit: if you have a single model without overfitting, then simply combine the predictions of these models (average, weighted average, logistic regression), then the resulting model will not over fit.
Unsupervised learning
7. Clustering Algorithms
Clustering is the task of grouping a series of objects with the goal of making objects in the same group (cluster) more similar than objects in other groups.
According to the clustering idea:
1. Clustering based on partitioning:
K-means, k-medoids (representing one sample point in each category), CLARANS.
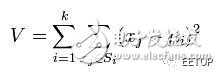
K-means is to minimize the value of the following expression:

Advantages of the k-means algorithm:
(1) The k-means algorithm is a classic algorithm for solving clustering problems. The algorithm is simple and fast.
(2) For processing large data sets, the algorithm is relatively scalable and efficient because its complexity is approximately O(nkt), where n is the number of all objects, k is the number of clusters, and t is the iteration The number of times. Usually k<
(3) The algorithm attempts to find the k partitions that minimize the value of the squared error function. When the clusters are dense, spherical or lumpy, and the difference between clusters and clusters is obvious, the clustering effect is better.
Disadvantages:
(1) The k-average method can only be used if the average value of the cluster is defined, and the data for some classification attributes is not suitable.
(2) The user is required to give the number k of clusters to be generated in advance.
(3) Sensitive to initial values, which may result in different clustering results for different initial values.
(4) It is not suitable for finding clusters of non-convex shape, or clusters of large difference in size.
(5) For "noise" and isolated point data, a small amount of this type of data can have a significant impact on the average.
2. Hierarchical-based clustering:
Bottom-up condensation methods, such as AGNES.
Top-down splitting methods, such as DIANA.
3. Density-based clustering:
DBSACN, OPTICS, BIRCH (CF-Tree), CURE.
4. Grid-based approach:
STING, WaveCluster.
5. Model-based clustering:
EM, SOM, COBWEB.
Each clustering algorithm is different. Here are some examples:
Centroid-based algorithm
Connection-based algorithm
Density based algorithm
Probability
Dimensionality reduction
Neural network / deep learning
8. Principal Component Analysis (PCA)
PCA is a statistical process that converts observations of a set of potentially related variables into values ​​of a set of linearly uncorrelated variables by using orthogonal transformations, which are called principal components.
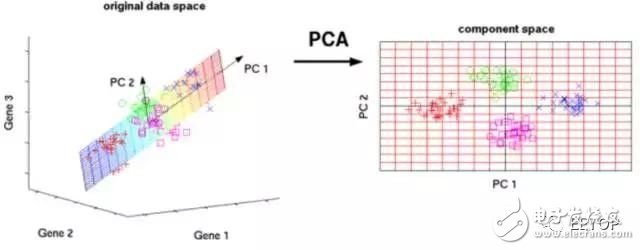
Some applications of PCA include compression, simplified data for easy learning, visualization, and more. Please note that domain knowledge is very important when choosing whether to continue using PCA. The data is noisy (all components of PCA have a high variance) does not apply.
9. Singular Value Decomposition (SVD)
In linear algebra, SVD is the factorization of complex matrices. For a given m * n matrix M, there is a decomposition such that M = U Σ V, where U and V are 酉 matrices and Σ is a diagonal matrix.
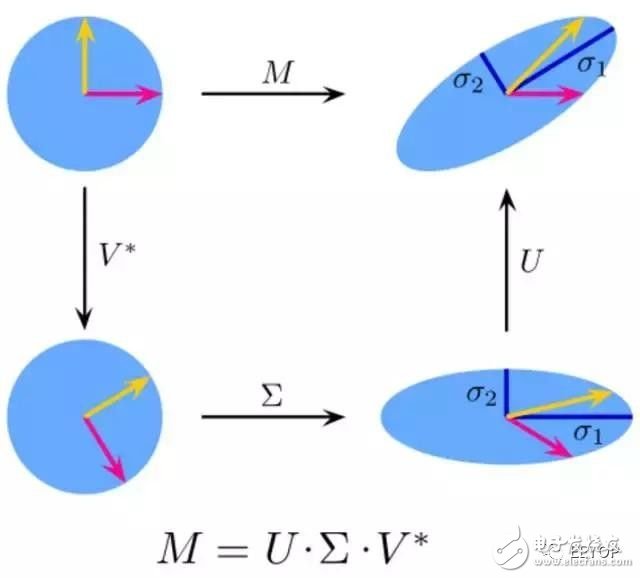
In fact, PCA is a simple application of SVD. In computer vision, the first face recognition algorithm uses PCA and SVD to represent the face as a linear combination of "feature faces", perform dimensionality reduction, and then match the face to identity by a simple method, although modern methods are more complex. But many aspects still rely on similar technologies.
10. Independent Component Analysis (ICA)
ICA is a statistical technique used primarily to reveal hidden factors in random variables, measurements, or signal sets. The ICA defines a generation model for the observed multivariate data, which is usually a large database as a sample. In the model, it is assumed that the data variables are linearly mixed by some unknown latent variables, and the mixing method is also unknown. The latent variables are assumed to be non-Gaussian and independent of each other, and they are called independent components of the observed data.
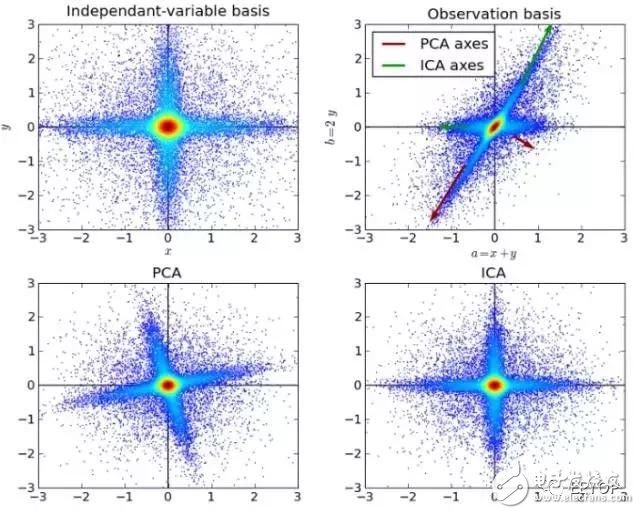
ICA is related to PCA, but when these classic methods fail completely, it is a more powerful technique that can identify potential sources of the source. Applications include digital images, document databases, economic indicators, and psychometrics.
11. Neural Network (Neural Networks)
Neural Networks is suitable for an input that may fall into at least two categories
NN consists of several layers of neurons, and the connections between them
The first layer is the input layer, and the last layer is the output layer.
Have their own classifier in both the hidden and output layers
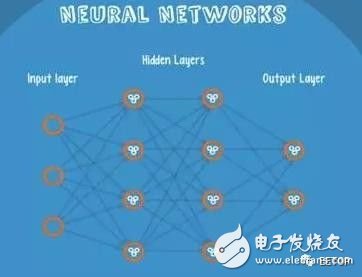
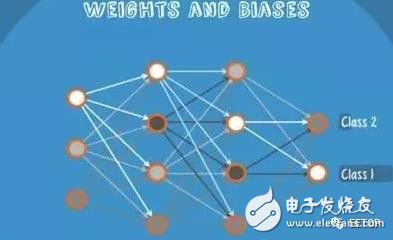
The input is input to the network, activated, the calculated score is passed to the next layer, the subsequent neural layer is activated, and the score on the node of the output layer represents the scores belonging to each class. The following example shows the classification result as class 1
The same input is transmitted to different nodes, and the different results are obtained because the respective nodes have different weights and biases.
This is the forward propagation
12. Markov Chains
Markov Chains consists of state and transitions
Chestnut, according to the phrase 'the quick brown fox jumps over the lazy dog', to get the markov chain
Step, first set each word to a state, then calculate the probability of transition between states
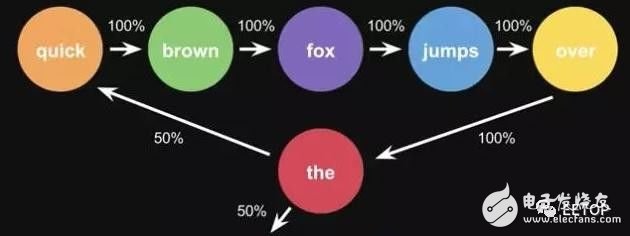
This is the probability of a sentence. When you use a lot of text to do statistics, you will get a larger state transition matrix, such as the words that can be connected later, and the corresponding probability.
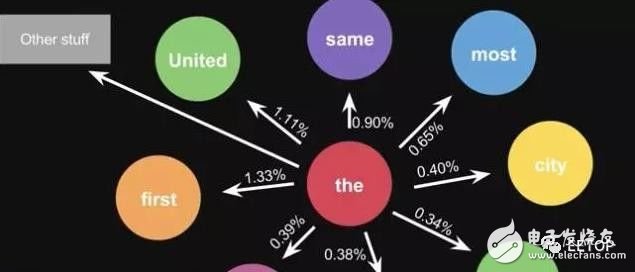
In life, the alternative result of the keyboard input method is the same principle, the model will be more advanced

Data Cable, HDMI Cable, USB Cable for TV and Computer
Data Cable, HDMI Cable, USB Cable
Ningbo Multitasking Electronic Co.,Ltd , https://www.smartmultesic.com