Modern electronic equipment has higher and higher requirements on the efficiency and volume of power supply and safety requirements. Many factors that determine the efficiency and volume and safety requirements in switching power supplies are basically related to switching transformers, and are related to the technical performance of switching transformers. It must be regarded as the core material of the transformer. The hysteresis loss and eddy current loss of the core material of the transformer are the most important factors determining the technical performance of the core material of the transformer. Therefore, it is necessary to perform hysteresis loop measurement on the core material of the transformer.
Measurement of the core hysteresis loop of a switching power transformer:The core of the transformer is generally made of ferromagnetic material. In addition to the high magnetic permeability of the ferromagnetic material, another important magnetic characteristic is that the magnetic flux density B and the magnetic field strength H are different by one phase during the magnetization process of the ferromagnetic material. This property is called hysteresis. Therefore, when the iron core of the transformer is magnetized by the alternating magnetic field, the magnetization curve of the iron core of the transformer is also called a hysteresis loop. The hysteresis loop is the relationship between the internal magnetic field strength H and the magnetic flux density B of the medium. By testing the hysteresis loop of the transformer core, it is easy to see the main electrical properties of the core material of the transformer.
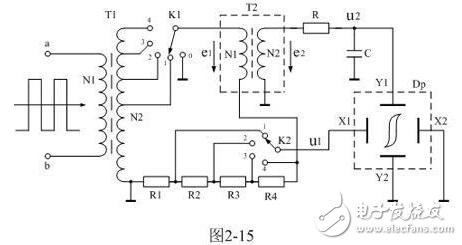
It is cumbersome to rigorously test the hysteresis loop parameters of ferromagnetic materials, but it is easier to display hysteresis loops with an oscilloscope. Figure 2-15 is a schematic diagram of measuring the hysteresis loop of a transformer core with an oscilloscope. In Figure 2-15, transformer T1 is the signal source. The voltage output of the signal source can be changed by K1 selecting the tap of the secondary coil of transformer T1; T2 is the sample of the transformer to be tested, Dp is the oscilloscope; R1, R2, R3, R4 In order to display the sampling resistance of the magnetic field strength H, the sampling voltage u1 is used as the oscilloscope X-axis deflection display input voltage, and the sampling voltage output can be selected by K2, so that the width of the oscilloscope X-axis deflection display can be changed; the resistance R and the capacitance C are integration circuits, and the integral The voltage u2 is output from both ends of the capacitor C, and the input voltage is displayed as the y-axis deflection of the oscilloscope to display the magnetic flux density B.

Below we will analyze the working principle of Figure 2-15 in detail. According to the Ampere loop law: the magnetic field strength vector is integrated over one line of any closed path, equal to the current algebra sum of the area enclosed by the closed path. And Kirchhoff's law of magnetic circuit: in the magnetic field loop, the algebraic sum of the magnetic flux potential NI (N is the number of turns of the coil, I is the current intensity) in any direction of the winding is equal to the magnetic pressure drop Hili (Hi is the magnetic field The strength, li is the algebraic sum of the magnetic field strength in the magnetic circuit is the average length of Hi. If the excitation current flowing through the primary coil of the transformer T2 is i1, the magnetization field strength in the sample transformer core can be determined as:
H = N1i1/l (2-32)
Where: l is the average magnetic path length of the transformer sample core. Let R1 terminal voltage be u1, then you can get:
I1 = u1/R1 (2-33)
H = N1*u1/R1*l (2-34)
(2-34) shows that in Figure 2-15, the sampling voltage u1 is proportional to the magnetic field strength H at any time. Therefore, the voltage u1 can be used as the oscilloscope X-axis input voltage, and the magnetic field strength is displayed in the horizontal direction of the oscilloscope. H.
Let us look at how to display the magnetic flux density B. According to Faraday's law of electromagnetic induction, under the action of alternating magnetic field, the magnitude of the electromotive force e2 induced in the secondary coil of transformer T2 is:
E2 = N2dΦ / dt = N2SdB / dt (2-35)
(2-35) where e2 is the induced electromotive force generated by the secondary coil of transformer T2, N2 is the number of turns of the secondary coil of transformer T2, Φ is the magnetic flux in the transformer core, and S is the effective magnetic permeability of the transformer core. Cross-sectional area.
The magnetic flux density B can be obtained by integrating the equation (2-35):

It can be seen from (2-35) and (2-36) that the induced electromotive force is the differential of the magnetic flux density with respect to time, and the magnetic flux density should be the integral of the induced electromotive force with respect to time. Therefore, the display of the magnetic flux density B must be composed of an integrating circuit. In Figure 2-15, the RC circuit has exactly this integral characteristic.
In principle, the display distortion of the hysteresis loop is minimized only when the characteristics of the output voltage of the RC integrator circuit are substantially the same as the characteristics (rate) of the output voltage of the magnetic field strength sampling circuit. Then, is the variation characteristic of the u1 voltage and the variation characteristic of the u2 voltage substantially the same? For simplicity and ease of analysis, here we consider the input voltage as an AC pulse square wave, but it is equally valid for a sinusoidal voltage.
If the voltage drop u1 across the sampling resistor R1 is ignored, the voltage e1 applied across the transformer is:
E1 ≈L1di1/dt (2-37)
From this, the excitation current flowing through the primary winding of the transformer can be determined as:
I1 = = +i1(0) - the input voltage is square wave (2-38)
(2-38) where e1 is the voltage applied to the two ends of the primary winding of the transformer T2 (here, square wave), or the voltage output from the secondary winding of the T1 transformer (square wave); L1 is the inductance of the primary winding of the transformer T2, i1 (0) is the excitation current in the primary winding of transformer T2 when time is equal to zero. In fact, i1(0) here has to correspond to the charging voltage u2(0) corresponding to the capacitor C in the integrating circuit at the same time, and the corresponding magnetic flux density B(0) corresponds to each other because it is between them. There is a phase difference.
It can be seen from (2-38) that if the voltage drop u1 across the sampling resistor R1 is ignored, the excitation current flowing through the primary winding of the transformer T2 is a linear current, that is, the output voltage u1 of the sampling resistor R1 is a sawtooth wave, just right. Corresponds to the scan voltage of the oscilloscope's X axis.
Let us analyze the output voltage of the RC integration circuit. If the circuit loss is ignored, the e2 load loop equation is:
E2 = N2SdB/dt = i2R+u2 (2-39)
In (2-39), i2 is the current flowing through the resistor R, or the charging current of the capacitor, and u2 is the voltage across the capacitor C. As with the analysis of the excitation current in the primary coil of the transformer, if the time constant of the integration circuit is made large enough and the resistance of the resistor is sufficiently large, the voltage drop of the charging voltage u2 across the capacitor in one cycle is negligible. of. Then (2-39) can be rewritten as:
E2 ≈ i2R (2-40)
At any one time, the charging current of capacitor C is:
I2 = dq/dt=Cdu2/dt (2-41)
In (2-41), q is the charge accumulated by charging the capacitor. Therefore, (2-40) can be expressed as:
E2 ≈ i2R = RCdu2/dt (2-42)
Substituting (2-42) results into (2-36) can be obtained:
B =R*C*u2/N2*S +B(0) (2-43)
(2-43) where B(0) is the magnetic flux density in the T2 transformer core when time is equal to zero. Similarly, it is meaningful that B(0) corresponds to the excitation current i1(0) in the primary winding of transformer T2 at the same time (ie, when the time is equal to zero). In fact, the values ​​of i1(0) and B(0) cannot be 0 at the same time. If i1(0) and B(0) are both 0, the graph displayed by the oscilloscope will be a diagonal line (ie, the ideal magnetization curve).
It can be seen from equation (2-43) that the magnetic flux density B is indeed proportional to the voltage u2 across the integral capacitor C; that is, the hysteresis loop can represent the magnetic field strength H and the magnetic flux density by u1 and u2, respectively. B is displayed by an oscilloscope.
In addition, it can be seen from (2-40) and (2-42) that if the voltage drop u2 across the integrating capacitor C is ignored, the current charging the capacitor C can basically be regarded as a constant current, that is, an integrating capacitor. The voltage u2 across C is a sawtooth wave, which is exactly the same as the characteristic (rate) of the output voltage u1 of the magnetic field strength sampling circuit. If during the analysis, the voltage drop u1 across the sampling resistor R1 and the voltage drop u2 across the integrating capacitor C cannot be ignored; then, the voltage drop u1 across the sampling resistor R1 and the voltage u2 across the integrating capacitor C can also be solved by unary. The second differential equation is obtained.
In fact, using differential equations to solve the charging and discharging process of inductors and capacitors, there has been a very detailed analysis in the content of the first chapter, which is not intended to be repeated here. In fact, the process of charging the inductor through the resistor and the process of charging the capacitor through the resistor are very similar. Both of them rise exponentially, except that the former changes the current and the latter changes. The parameter is voltage. As long as the time constants of the two are basically the same, their curvature of curvature will be basically the same. Therefore, using u1 and u2 to represent the magnetic field strength H and the magnetic flux density B, respectively, the hysteresis loop display distortion on the oscilloscope is small. The time constant Ï„=RL at which the voltage charges the inductor through the resistor, and the time constant Ï„=RC at which the current charges the capacitor through the resistor.
In Figure 2-15, switch K1 is used to select the input voltage amplitude. When K1 selects the position of "1", the amplitude of the input voltage is relatively small, and the hysteresis loop area of ​​the sample to be tested is also small; when K1 When the position of "4" is selected, the magnitude of the input voltage is relatively large, and the hysteresis loop area of ​​the sample to be tested is also large.
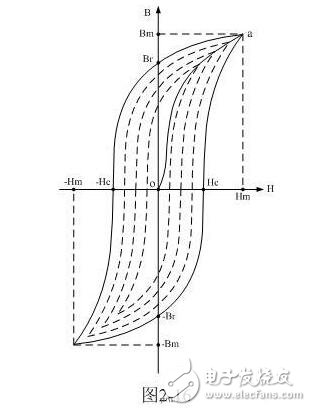
Figure 2-16 shows the test samples corresponding to different hysteresis loops when inputting voltages of different amplitudes. In Figure 2-16, the outermost hysteresis loop is the hysteresis loop pattern displayed when the switch K1 selects the position of "4"; and the innermost hysteresis loop is the corresponding switch K1 select "1" The position of the hysteresis loop is displayed when the position is displayed. The switch K2 is used to select the horizontal width of the display, the magnetic field strength in the transformer core and the magnitude of the magnetic flux density, regardless of the position selected by the switch K2. When K2 selects the position of "1", the horizontal width of the display graphic is the narrowest; when K2 selects the position of "4", the horizontal width of the display graphic is the widest. In addition, the initial magnetization curve of oa in Figure 2-16 is difficult to see in actual measurement because it can only appear once and will not be repeated.
As can be seen from Figure 2-16, when there is no magnetization field in the transformer core, both H and B are zero, that is, the coordinate origin 0 of the B-H curve in Figure 2-16. As the magnetic field strength H increases, the magnetic flux density B also increases, but there is no linear relationship between the two. When H increases to a certain value, B no longer increases (or increases very slowly), which indicates that the magnetization of the transformer core is near saturation. Hm and Bm are generally referred to as maximum magnetic field strength and maximum magnetic flux density (corresponding to point a in the figure), and Hs and Bs are referred to as saturation magnetic field strength and magnetic flux density, respectively.

If H is gradually retreated to zero, then B is gradually reduced. However, the curve trajectory corresponding to H and B does not return along the original curve trajectory a-0, but decreases along another curve to Br, which means that when H drops to zero, a certain magnetic property remains in the ferromagnetic material. The phenomenon is called hysteresis and Br is called remanence. Reverse the magnetic field and gradually increase its intensity until H = -Hc, the magnetic flux density disappears, which means that to eliminate the residual magnetism, the reverse magnetic field Hc must be applied. Hc is called coercivity. Its size reflects the ability of the ferromagnetic material to maintain the remanent state. Figure 2-16 shows that when the magnetic field changes in the order of Hm→0→-Hc→-Hm→0→Hc→Hm, the corresponding change experienced by B is Bm→Br→0→-Bm→-Br→0→Bm . Then a closed B ~ H curve is obtained, called the hysteresis loop. Therefore, when the ferromagnetic material is in an alternating magnetic field (such as the iron core in a transformer), it will be repeatedly magnetized → demagnetized → reverse magnetized → reverse demagnetized along the hysteresis loop. In this process, additional energy is consumed and released from the ferromagnetic material in the form of heat, which is called hysteresis loss. It has been previously demonstrated that the hysteresis loss is proportional to the area enclosed by the hysteresis loop.
The maximum magnetic flux density Bm and remanence Br, and the magnetic coercive force Hc are different for different magnetic field strengths. Therefore, it is difficult to define various parameters of a ferromagnetic material without comparison. Bad.
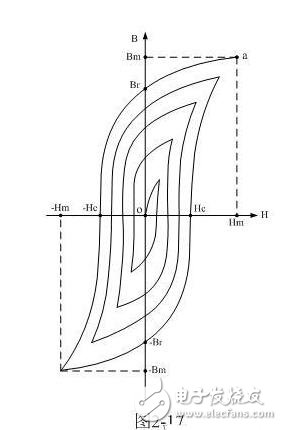
The circuit in Figure 2-15 can also be used to demagnetize a transformer core or ferromagnetic material. The method is to first switch the switch K1 to the position of "4", let the transformer core be magnetized first, and then switch the switch K1 from the "4" position to the position of "3, 2, 1, 0" one by one, and finally the magnetic field. The intensity will be zero and the residual flux density Br will also be substantially zero. Since the input voltage is an alternating voltage, the phase of the demagnetization starting point is random. Figure 2-17 Road diagram of transformer core or ferromagnetic material demagnetization. In Figure 2-17, it is assumed that the magnetic flux density and magnetic field strength are both from the maximum value (ie, point a).
By the way, it is preferable that the transformer core sample used for testing the hysteresis loop is a magnetic ring because the ordinary E-type transformer core has an air gap somewhat; the general air gap reluctance is the magnetic resistance of the ferromagnetic material. Tens of thousands of times, therefore, even if the length of the air gap is only one ten thousandth of the total magnetic path length, its influence on the test results is very large.
In addition, the test circuit shown in Figure 2-15 cannot be used to test the magnetization curve of a single-excited transformer core because the input voltage is a bipolar pulse voltage. To test the magnetization curve of a single-excited transformer core, a rectifier diode can be connected to the voltage output of K1.

Testing the magnetization curve of a single-excited transformer core does not make much sense in application, because the area of ​​the magnetization curve is very small compared to the area of ​​the magnetization curve of the double-excited transformer core. Therefore, for a single-excited transformer iron The core's magnetization curve is tested, instead it is replaced by testing the magnetization curve of the double-excited transformer core.
Judgment of the short circuit between switching power supply transformers:
1. Use a mains to 12 volt switching power supply to solder two leads on the high-frequency low-voltage output side of the switching power supply transformer (that is, before entering the rectification filter) and then connect the 12V2W small bulb to the high-frequency output side without rectification filtering. Enter the secondary side of the switching transformer to be tested. If the bulb is slightly reddish and not bright after being connected, the short-circuit test transformer is bright after any winding. It proves that the switching transformer is good. If it is not needed, short-circuit the winding bulb. It is very bright that the switch transformer has a turn-to-turn short circuit.
2. Connect a 10 to the micro-capacitor on the primary winding of the switching transformer and then connect the winding with the capacitor to the capacitance measuring end of the digital multimeter. Capacitance measurement position is used to measure the capacitance, and then the output of the switching transformer is arbitrary. A winding short-circuit measurement capacity, if the number displayed by the two-meter multimeter is the same or the difference is not large, it can be judged as a transformer short-circuit, such as the difference between the two measurements, the transformer is normal.

3. In the case of checking the winding resistance or the path, judging whether the switch transformer is good or not, there are four ways:
1. Replacement method, replace the test with a good transformer. Or use the suspected bad, put it on other circuits and test it;
2. Detect by voltage/current instantaneous method, measure two transformers at the same time, compare the test data. The secondary winding is instantaneously connected with a 1.5V battery, and the (inductive) short-circuit current value of the primary winding is measured; when the value of the induced current is severely small, the transformer is bad.
3. Change the two measurement methods, such as the 2 method. After measuring the induced current value, wear a short-circuited wire and measure it once. The two measurements are close, and the transformer is judged to be bad. If the second measurement is seriously small, the transformer is good.
4. Test the quality with the voltage ringing method. Need kHz level (not sure) one signal generator and one oscilloscope, with the measurement, see its attenuation waveform, if the oscillation is quickly attenuated during the pulse flat top, the transformer is broken. The opposite is true. Testers need to have some experience, and there are counts on good waveforms.
The four detection methods are all based on the principle that the electromagnetic induction capability (inductance characteristic) is deteriorated after the transformer is short-circuited between turns.
Shenzhen Esun Herb Co.,Ltd. , https://www.szyoutai-tech.com
